Bifogade filer
 File
File
Beskrivning
| Land | Sverige |
|---|---|
| Lista | First North Stockholm |
| Sektor | Tjänster |
| Industri | IT-konsult & onlinetjänster |
Intresserad av bolagets nyckeltal?
Analysera bolaget i Börsdata!

Vem äger bolaget?
All ägardata du vill ha finns i Holdings!


Wyld Networks AB (publ) year-end report 2025
Fourth quarter 2025 (compared to the same period last year)
- Net sales amounted to TSEK -1,554 (30).
- Total income amounted to TSEK -345 (1,287).
- Total operating expenses were reduced by 49%, costs amounted to TSEK -7,741 (-15,465)
- Operating profit improved by 43% to TSEK -8,086 (-14,178).
- Earnings per share before dilution amounted to SEK -0.003 (-0.025)
Full year 2025 (compared to full year 2024)
- Net sales amounted to SEK 0 thousand (386).
- Total income amounted to TSEK 3,643 (7,409).
- Total operating expenses were reduced by 40%, costs amounted to TSEK -30,404 (-50,617)
- Operating profit improved by 38% to TSEK -26,761 (-43,208).
- Earnings per share before dilution amounted to SEK -0.017 (-0.075)
Significant events during the fourth quarter of 2025
- On October 1, the company announced that Mats R Andersson will leave Wyld Networks' Board of Directors immediately and at the same time Kjell Olovsson is proposed to be elected to Wyld Networks' Board of Directors.
- On October 2, the company announces deliveries of satellite IoT terminals and weather stations to Corteva in accordance with a previously announced order.
- On November 14, an Extraordinary General Meeting will be held to resolve on (i) a reverse share split of 500:1 shares, (ii) a change in the company's limits of the share capital, (iii) the election of Kjell Olovsson to the Board of Directors and the re-election of Mats L Andersson and Scott Moore to the Board of Directors, (iv) and determination of the remuneration to the Board of Directors and the Chairman of the Board of Directors.
- On November 26, the Company announces that it will raise a loan facility of a total of SEK 6.7 million issued by a consortium of major shareholders, in order to finance the Company's continued commercialization where the focus is on increasing delivery capacity to meet the demand for the Company's products and services.
- On December 8, the company announced that Alastair Williamson, then CEO, has decided to leave his position in the company. The company's board member Kjell Olovsson will take over as CEO as of January 1, 2026.
- On December 15, the company announces that the Peruvian telecommunications regulator MTC approves a license to implement Wyld Network's L-Band satellite IoT solution, paving the way for commercial use of the company's solution.
- On December 17, the company announces that it has received an additional order for the delivery of 100 Wyld Connect satellite terminals worth SEK 250,000 from Dataflowlab.io (formerly EAT). According to the agreement, the 100 terminals will be delivered in December 2025.
Significant events after the end of the period
- On March 16, the Board of Directors announces that Mats L Andersson is resigning at his own request.
CEO Comments
Dear Shareholders,
I took over as CEO on January 1 this year. A large part of my initial time has been spent analyzing the company's business and the market segments in which we operate. The aim has been to identify new approaches - both in existing areas and to find opportunities for expansion.
During this review, a new segment has emerged as particularly interesting and promising. With a clear focus on the right customers, I believe that the potential for Wyld's products in this area is significant. We intend to return with more information about this segment in the near future.
Since January, we have also implemented a cost-cutting program. This has been necessary both to reduce the cost base and to free up resources for the segments where we see the greatest potential and returns.
The result for Q4 is not satisfactory, neither for the company nor its owners. At the same time, I am convinced that, through increased focus, clearer priorities and strong customer work, we have good opportunities to turn the trend around in 2026.
Kjell Olovsson
President and CEO
|
|
|
About Wyld
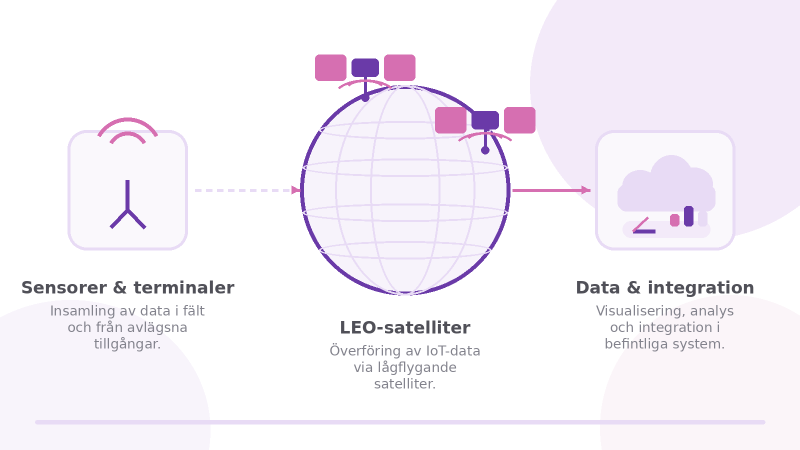
Wyld Networks AB is a technology company in satellite-based IoT communication. The company develops and sells connectivity solutions that enable the collection and transmission of sensor data in areas where traditional mobile networks are missing or limited.
Activities & offers
Wyld Networks combines terrestrial and satellite networks to create cost-effective IoT connectivity with a wide geographical range. The offering includes Wyld Connect, modules and terminals for sensor-to-satellite communication, as well as Wyld Fusion, a platform fordata management, visualization and integration.
Positioning
The company's solutions are designed for rapid integration into existing IoT environmentsand are targeted at applications whererobust data collection in remote environments is central, such as agriculture, energy, utilities and environmental monitoring.
Investment case in brief
Wyld Networks addresses the need for connectivity for sensors and assets in geographies where conventional mobile coverage is not sufficient.
Financial Information
Fourth quarter 2025
Income statement
The Group's net sales amounted to TSEK -1,554 (30) during the fourth quarter, the negative net sales are attributable to an adjustment of previously accrued revenues of SEK 556 thousand reported in the fourth quarter of 2023. The company makes the assessment that previously booked revenues will not be delivered in full and will therefore return the revenues in the financial statements for 2025.
The Group's other income amounted to TSEK 1,209 (1,257), which is attributable to development grants in the UK.
The Group's costs attributable to merchandise amounted to SEK -473 (-940), costs attributable to personnel amounted to SEK -2,389 (-8,188) and other external costs amounted to SEK -4,158 (-6,172) in the fourth quarter of 2025. In the fourth quarter, the Group has made a provision for unrealized forward losses of SEK 750 thousand relating to currency exchange between SEK - GBP, the item is classified as other operating expenses in the interim report. The Group's operating expenses have decreased by 49% compared to the same period last year.
Operating profit amounted to SEK -8,086 million (-14,178), which is a profitability improvement of 43% compared to the same period last year.
Loss for the period amounted to TSEK -8,163 (-15,216), corresponding to earnings per share before dilution of SEK -0.003 (-0.025).
Balance sheet
The Group's non-current assets amounted to TSEK 464 (1,009), which refers to both intangible and tangible assets. The Parent Company has shares in subsidiaries valued at SEK 22,248 thousand as of the end of December 2025. The Group's current assets amounted to SEK 4,701 thousand (10,622), of which SEK 1,657thousand (3,170) pertains to cash banking.
The Group's equity amounted to TSEK -2,708 (3,742) and the Parent Company's equity amounted to TSEK 18,077 (40,584) as of the end of December 2025. The parent company's equity has been affected by the write-down of shares in subsidiaries, which has significantly reduced equity in the fourth quarter. The company's Board of Directors makes the assessment that the value of shares in the subsidiary reflects the fair value after the write-down.
The Group has interest-bearing liabilities of SEK 3,249 thousand as of the end of December 2025.
Cash flow statement
The Group's cash flow from operating activities amounted to TSEK -7,292 (-16,792).
The Group's cash flow from financing activities amounted to SEK 3,249 thousand (18,923) in the fourth quarter. The Group has taken out a loan from a strategic investor of SEK 3,249 thousand in the fourth quarter.
The company's cash and cash equivalents amounted to SEK 1,657 thousand. The company's net debt amounted to SEK 1,592 thousand as of the end of December, at the same time last year the group had a net cash position of SEK 3,170 thousand.
Full year 2025
Income statement
The Group's net sales amounted to SEK 0 thousand (386) for the full year 2025.
The Group's other income amounted to TSEK 3,643 (7,023), which is attributable to development grants in the UK.
The Group's costs attributable to merchandise amounted to SEK -2,039 (-1,746), costs attributable to personnel amounted to SEK -14,794 (-29,244) and other external costs amounted to SEK -12,446 (-18,990) for the full year 2025. Costs have decreased by about 40% in the full year 2025 compared to 2024.
Operating profit amounted to SEK -26,761 (-43,208), which is a profitability improvement of 38% compared to the same period last year.
Loss for the period amounted to TSEK -27,537 (-46,654), corresponding to earnings per share before dilution of SEK -0.017 (-0.075).
Cash flow statement
The Group's cash flow from operating activities amounted to TSEK -26,517 (-45,100).
The Group's cash flow from financing activities amounted to TSEK 25,050 (28,318) in 2025. The Group has carried out a new share issue of approximately SEK 30 million during 2025. Issue costs amounted to approximately SEK -8 million. In addition, the company has taken out a loan of approximately SEK 3.3 million in 2025.
Shares
The Group has 2,993,330,905 shares as of the end of December 2025. Average number of shares in the fourth quarter 2,993,330,905 both before and after dilution. The average number of shares for the full year 2025 amounted to 1,590,756,787 both before and after dilution. At the Annual General Meeting on November 14, 2025, it was resolved on a reverse share split 500:1, which means that 500 current shares will be consolidated into one new share in the company, the execution of the reverse share split was carried out in January 2026 when the company received permission from the Swedish Companies Registration Office.
The Company's Board of Directors makes the assessment that the current option program will not be subscribed for given the discrepancy that exists between the subscription price and the share price. The Board of Directors has therefore decided not to include dilution from the option programs in the calculation of the average number of shares after dilution in this report.
Funding next 12 months
The company is actively exploring various financing solutions to strengthen the company's financial position for the full year 2026. The company's Board of Directors monitors developments and continuously evaluates various financing solutions to maximize shareholder value over time.
Other Information
Financial Calendar
Annual Report 2025 will be presented on May 22, 2026
Interim report Q1 2026 to be presented on May 29, 2026
The 2026 Annual General Meeting will be held on June 30, 2026
Interim report Q2 2026 to be presented on August 31, 2026
Interim report Q3 2026 to be presented on November 30, 2026
Year-end report 2026 to be presented on March 29, 2027
Auditor
This interim report has not been reviewed by the company's auditor.
Assurances
The Board of Directors and the CEO assure that the interim report gives a true and fair view of the company's operations, position and results.
Forward-Looking Statements
This Interim Report may contain statements about, among other things, Wyld Network's financial situation and profitability, as well as statements about growth and long-term market potential that may be forward-looking. Wyld Networks believes that the expectations reflected in these forward-looking statements are based on reasonable assumptions. However, forward-looking statements involve risks and uncertainties, and actual results or consequences could differ materially from those made. Except as required by applicable law, forward-looking statements speak only as of the date they are made and Wyld Networks undertakes no obligation to update any of them in light of new information or future events.
Certified Adviser
Mangold Fondkommission AB acts as the company's Certified Adviser.
E-mail: [email protected]
For further information, please contact:
Kjell Olovsson, CEO
[email protected]
Income Statement - Group
|
| 2025 | 2024 | 2025 | 2024 |
| SEK thousand | Q4 | Q4 | Full year | Full year |
| Net sales | -1 554 | 30 | 0 | 386 |
| Other operating income | 1 209 | 1 257 | 3 643 | 7 023 |
| Total operating income | -345 | 1 287 | 3 643 | 7 409 |
|
|
|
|
|
|
| Raw materials | -473 | -940 | -2 039 | -1 746 |
| Other external costs | -4 158 | -6 172 | -12 446 | -18 990 |
| Personnel costs | -2 389 | -8 188 | -14 794 | -29 244 |
| Depreciation of tangible and intangible fixed assets | -70 | -143 | -442 | -582 |
| Other operating expenses | -651 | -22 | -683 | -55 |
| Total operating expenses | -7 741 | -15 465 | -30 404 | -50 617 |
|
|
|
|
|
|
| Operating profit | -8 086 | -14 178 | -26 761 | -43 208 |
|
|
|
|
|
|
| Interest expenses and similar profit and loss items | -77 | -1 038 | -776 | -3 446 |
| Total financial items | -77 | -1 038 | -776 | -3 446 |
|
|
|
|
|
|
| Profit after financial items | -8 163 | -15 216 | -27 537 | -46 654 |
|
|
|
|
|
|
| Profit for the year | -8 163 | -15 216 | -27 537 | -46 654 |
|
|
|
|
|
|
| Earnings per share before dilution (SEK) | -0,003 | -0,025 | -0,017 | -0,075 |
| Earnings per share after dilution (SEK) | -0,003 | -0,018 | -0,017 | -0,055 |
Balance Sheet - Group
| SEK thousand | 2025-12-31 | 2024-12-31 |
| ASSETS |
|
|
| Fixed assets |
|
|
| Intangible fixed assets |
|
|
| Other intangible assets | 394 | 635 |
| Total intangible fixed assets | 394 | 635 |
|
|
|
|
| Property, plant and equipment |
|
|
| Inventory, tools and installations | 70 | 374 |
| Total property, plant and equipment | 70 | 374 |
|
|
|
|
| Total fixed assets | 464 | 1 009 |
|
|
|
|
| Current assets |
|
|
| Other receivables | 2 774 | 5 687 |
| Deferred expenses and accrued income | 270 | 1 765 |
| Cash and bank | 1 657 | 3 170 |
| Total current assets | 4 701 | 10 622 |
|
|
|
|
| TOTAL ASSETS | 5 165 | 11 631 |
|
|
|
|
| EQUITY AND LIABILITIES |
|
|
| Equity |
|
|
| Share capital | 14 854 | 2 862 |
| Other capital contributed | 145 639 | 128 050 |
| Other equity incl. profit for the year | -163 201 | -127 170 |
| Total equity | -2 708 | 3 742 |
|
|
|
|
| Current liabilities |
|
|
| Other financial liabilities | 3 249 | 0 |
| Trade payables | 2 186 | 2 347 |
| Other liabilities | 1 157 | 3 624 |
| Accrued expenses and deferred income | 1 281 | 1 918 |
| Total current liabilities | 7 873 | 7 889 |
|
|
|
|
| TOTAL EQUITY AND LIABILITIES | 5 165 | 11 631 |
Cash Flow Statement - Group
|
| 2025 | 2024 | 2025 | 2024 |
| SEK thousand | Q4 | Q4 | Full year | Full year |
| Ongoing operations |
|
|
|
|
| Operating profit | -8 086 | -14 178 | -26 761 | -43 208 |
| Adjustment for items that are not included in the cash flow | 2 553 | 373 | 2 925 | 582 |
| Net interest income | -77 | -1 038 | -776 | -3 446 |
| Cash flow from operating activities before changes in working capital | -5 610 | -14 843 | -24 612 | -46 072 |
|
|
|
|
|
|
| Cash flow from changes in working capital |
|
|
|
|
| Change in operating receivables | -1 056 | 962 | 2 060 | -194 |
| Change in operating liabilities | -626 | -2 911 | -3 965 | 1 166 |
| Cash flow from operating activities | -7 292 | -16 792 | -26 517 | -45 100 |
|
|
|
|
|
|
| Investment activities |
|
|
|
|
| Acquisition of tangible assets | 0 | -19 | -46 | -29 |
| Cash flow from investing activities | 0 | -19 | -46 | -29 |
|
|
|
|
|
|
| Financing activities |
|
|
|
|
| New share issue | 0 | 46 543 | 29 581 | 52 938 |
| Issue costs | 0 | -9 620 | -7 780 | -9 620 |
| Change in interest-bearing liabilities | 3 249 | -18 000 | 3 249 | -15 000 |
| Cash flow from financing operations | 3 249 | 18 923 | 25 050 | 28 318 |
|
|
|
|
|
|
| Cash flow for the period | -4 043 | 2 112 | -1 513 | -16 811 |
| Cash and cash equivalents at the beginning of the period | 5 700 | 1 058 | 3 170 | 19 981 |
| Cash and cash equivalents at the end of the period | 1 657 | 3 170 | 1 657 | 3 170 |
Change in Equity - Group
| SEK thousand | Share capital | Other capital | Other equity incl profit for the year | Total equity |
| 2024-01-01 | 1 429 | 115 545 | -110 290 | 6 684 |
| New share issue | 40 433 | 12 505 |
| 52 938 |
| Reduction of share capital | -39 000 |
| 39 000 | 0 |
| Issue costs |
|
| -9 620 | -9 620 |
| Translation differences |
|
| 394 | 394 |
| Profit for the period |
|
| -46 654 | -46 654 |
| 2024-12-31 | 2 862 | 128 050 | -127 170 | 3 742 |
| SEK thousand | Share capital | Other capital | Other equity incl profit for the year | Total equity |
| 2025-01-01 | 2 862 | 128 050 | -127 170 | 3 742 |
| New share issue | 11 992 | 17 589 |
| 29 581 |
| Issue costs |
|
| -7 779 | -7 779 |
| Translation differences |
|
| -715 | -715 |
| Profit for the period |
|
| -27 537 | -27 537 |
| 2025-12-31 | 14 854 | 145 639 | -163 201 | -2 708 |
Income Statement - Parent Company
|
| 2025 | 2024 | 2025 | 2024 |
| SEK thousand | Q4 | Q4 | Full year | Full year |
| Net sales | 17 | 0 | 373 | 0 |
| Other operating income | 1 | 0 | 13 | 18 |
| Total operating income | 18 | 0 | 386 | 18 |
|
|
|
|
|
|
| Raw materials | 0 | 0 | -301 | 0 |
| Other external costs | -1 544 | -4 519 | -5 098 | -8 833 |
| Personnel costs | 263 | -263 | 263 | -840 |
| Depreciation of tangible and intangible fixed assets | 0 | 0 | 0 | 0 |
| Write-down of shares in subsidiaries | -38 014 | -79 417 | -38 014 | -79 417 |
| Other operating expenses | -756 | -9 | -769 | -39 |
| Total operating expenses | -40 051 | -84 208 | -43 919 | -89 129 |
|
|
|
|
|
|
| Operating profit | -40 033 | -84 208 | -43 533 | -89 111 |
|
|
|
|
|
|
| Interest expenses and similar profit and loss items | -78 | -1 038 | -777 | -3 446 |
| Total financial items | -78 | -1 038 | -777 | -3 446 |
|
|
|
|
|
|
| Profit after financial items | -40 111 | -85 246 | -44 310 | -92 557 |
|
|
|
|
|
|
| Profit for the year | -40 111 | -85 246 | -44 310 | -92 557 |
Balance Sheet - Parent Company
| SEK thousand | 2025-12-31 | 2024-12-31 |
| ASSETS |
|
|
| Fixed assets |
|
|
| Financial fixed assets |
|
|
| Shares in subsidiaries | 22 248 | 39 659 |
| Total financial fixed assets | 22 248 | 39 659 |
|
|
|
|
| Total fixed assets | 22 248 | 39 659 |
|
|
|
|
| Current assets |
|
|
| Other receivables | 148 | 180 |
| Deferred expenses and accrued income | 140 | 119 |
| Cash and bank | 1 601 | 2 680 |
| Total current assets | 1 889 | 2 979 |
|
|
|
|
| TOTAL ASSETS | 24 137 | 42 638 |
|
|
|
|
| EQUITY AND LIABILITIES |
|
|
| Equity |
|
|
| Share capital | 14 854 | 2 862 |
| Premium reserve | 145 639 | 128 050 |
| Retained earnings | -114 879 | -43 674 |
| Profit for the year | -27 537 | -46 654 |
| Total equity | 18 077 | 40 584 |
|
|
|
|
| Current liabilities |
|
|
| Other financial liabilities | 3 249 | 0 |
| Trade payables | 1 543 | 1 236 |
| Other liabilities | 0 | 0 |
| Accrued expenses and deferred income | 1 268 | 818 |
| Total current liabilities | 6 060 | 2 054 |
|
|
|
|
| TOTAL EQUITY AND LIABILITIES | 24 137 | 42 638 |
Cash Flow Statement - Parent Company
|
| 2025 | 2024 | 2025 | 2024 |
| SEK thousand | Q4 | Q4 | Full year | Full year |
| Ongoing operations |
|
|
|
|
| Operating profit | -40 033 | -84 208 | -43 533 | -89 111 |
| Adjustment for items that are not included in the cash flow | 38 014 | 79 417 | 38 764 | 79 417 |
| Net interest income | -78 | -1 038 | -777 | -3 446 |
| Cash flow from operating activities before changes in working capital | -2 097 | -5 829 | -5 546 | -13 140 |
|
|
|
|
|
|
| Cash flow from changes in working capital |
|
|
|
|
| Change in operating receivables | 112 | 1 798 | 11 | 280 |
| Change in operating liabilities | 644 | -4 414 | 647 | -667 |
| Cash flow from operating activities | -1 341 | -8 445 | -4 888 | -13 527 |
|
|
|
|
|
|
| Investment activities |
|
|
|
|
| Shareholder contributions paid | -5 574 | -8 434 | -21 241 | -31 576 |
| Cash flow from investing activities | -5 574 | -8 434 | -21 241 | -31 576 |
|
|
|
|
|
|
| Financing activities |
|
|
|
|
| New share issue | 0 | 46 543 | 29 581 | 52 938 |
| Issue costs | 0 | -9 620 | -7 780 | -9 620 |
| Change in interest-bearing liabilities | 3 249 | -18 000 | 3 249 | -15 000 |
| Cash flow from financing operations | 3 249 | 18 923 | 25 050 | 28 318 |
|
|
|
|
|
|
| Cash flow for the period | -3 666 | 2 044 | -1 079 | -16 785 |
| Cash and cash equivalents at the beginning of the period | 5 267 | 636 | 2 680 | 19 465 |
| Cash and cash equivalents at the end of the period | 1 601 | 2 680 | 1 601 | 2 680 |
Change in Equity - The Parent Company
| SEK thousand | Share capital | Other capital | Other equity incl profit for the year | Total equity |
| 2024-01-01 | 1 429 | 101 085 | -12 691 | 89 823 |
| Provisions for previous years |
| -12 691 | 12 691 | 0 |
| New share issue | 40 433 | 12 505 |
| 52 938 |
| Reduction of share capital | -39 000 |
| 39 000 | 0 |
| Issue costs |
|
| -9 620 | -9 620 |
| Translation differences |
|
|
| 0 |
| Profit for the period |
|
| -92 557 | -92 557 |
| 2024-12-31 | 2 862 | 100 899 | -63 177 | 40 584 |
| SEK thousand | Share capital | Other capital | Other equity incl profit for the year | Total equity |
| 2025-01-01 | 2 862 | 100 899 | -63 177 | 40 584 |
| New share issue | 11 992 | 17 589 |
| 29 581 |
| Issue costs |
|
| -7 779 | -7 779 |
| Translation differences |
|
| 1 | 1 |
| Profit for the period |
|
| -44 310 | -44 310 |
| 2025-12-31 | 14 854 | 118 488 | -115 265 | 18 077 |
Notes
Note 1 Accounting policies
This interim report has been prepared in accordance with the Annual Accounts Act and the accounting principles applied are in accordance with BFNAR 2012:1 and the consolidated financial statements (C3). The company applies the same accounting principles and calculation methods as were applied in the annual report for 2024.
Note 2 Definition of key figures
Operating profit (EBIT) - Profit for the period including depreciation and amortization of property, plant and equipment and intangible assets, before financial items and tax.
EBITDA - Operating profit excluding depreciation and amortization of intangible and property, plant and equipment.
EBITDA% - EBITDA in relation to total operating revenue.
Earnings per share before dilution - Profit for the period divided by the average number of outstanding shares at the end of the period taking into account issues carried out during the period.
Earnings per share after dilution - Profit for the period divided by the average number of outstanding shares at the end of the period taking into account issued warrants and convertibles.
Equity per share before dilution - Equity divided by the number of shares outstanding at the end of the period.
Equity per share after dilution - Equity divided by the number of outstanding shares at the end of the period taking into account issued warrants and convertibles.
Average number of shares outstanding at the end of the period before dilution - Weighted number of shares outstanding during the period.
Average number of outstanding shares at the end of the period after dilution - Weighted number of outstanding shares during the period taking into account issued warrants (TO3 and warrants to staff, board of directors, consultants) and convertibles.
Order backlog - The order value of orders that have not yet been delivered or invoiced that are in the order register.
Equity ratio % - Equity in relation to total assets.
TKR - kronor in thousands
SEK million - SEK in millions